
How much ice are we talking about?
Earth's two great ice sheets hold almost all of its ice: Antarctica (about 26.5 million km³) and Greenland (about 2.9 million km³), plus mountain glaciers. Antarctica alone holds around 90% of the world's ice. Sea ice, which already floats, barely affects sea level when it melts; it's the ice on land that matters.
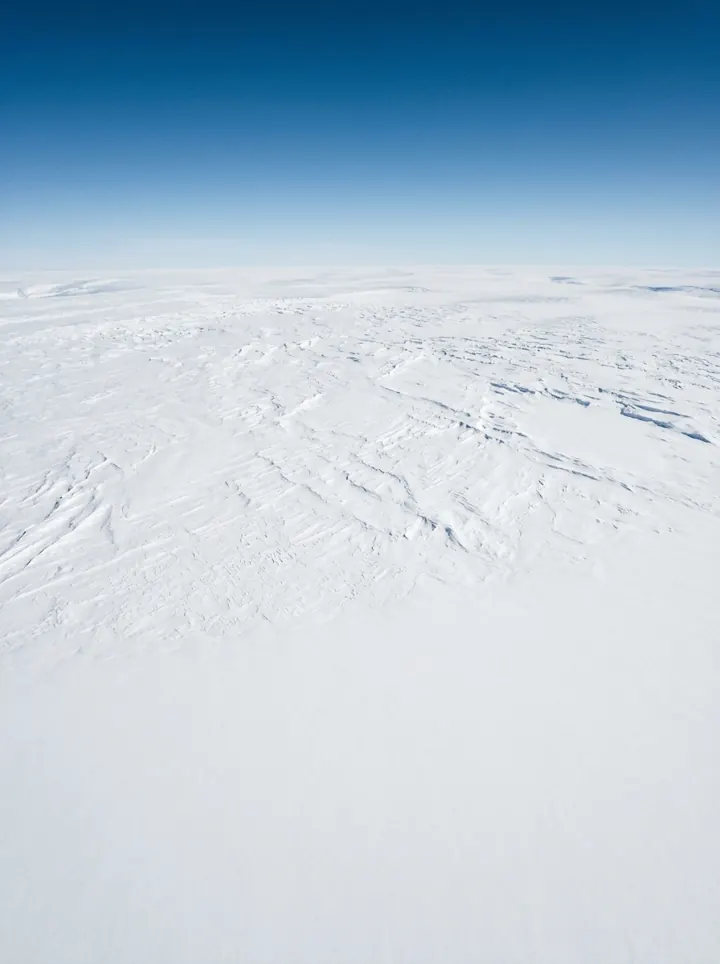
First: it's impossible (here's why)
Melting ice takes a lot of energy: about 334 kJ per kilogram just to turn it into water. Multiply that by roughly 27 million billion tonnes of ice and you get about 9 × 10²⁴ joules. All the sunlight hitting Earth in a day delivers about 1.5 × 10²² joules. So melting all the ice in one day would need roughly 600 days of all the Sun's energy reaching Earth, delivered at once and only to the ice.
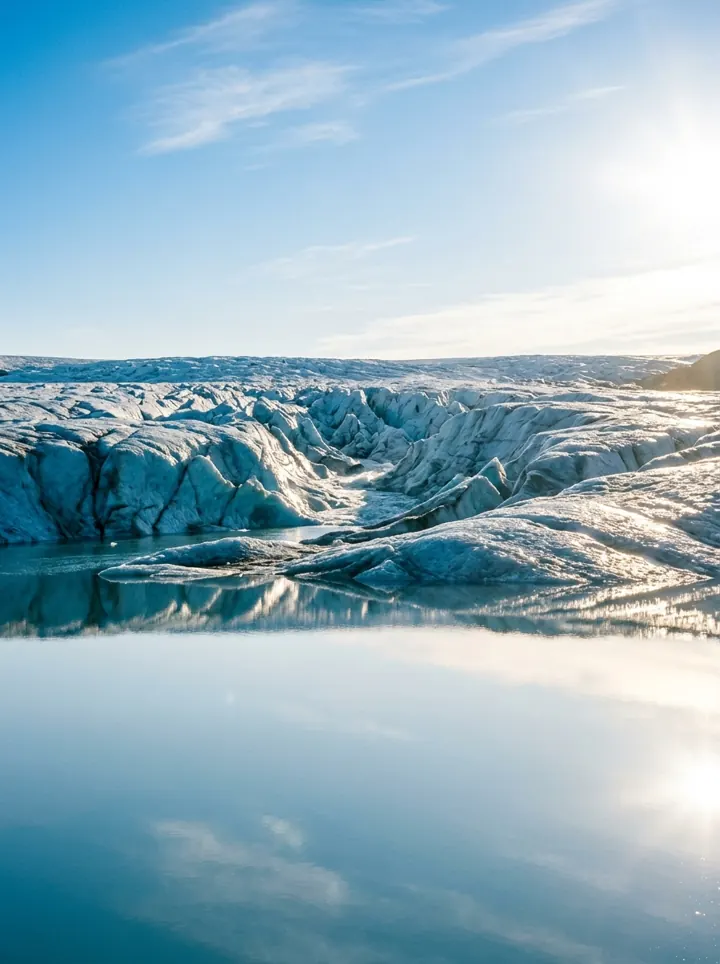
Then: the water arrives
Let's pretend anyway. The meltwater wouldn't appear in the oceans instantly; Antarctica's would pour off the continent over days and weeks. But the end point is clear.
- The ice is gone. Vast floods pour off Antarctica and Greenland into the oceans.
- Seas rise ~70 m. Roughly 58 m from Antarctica, 7 m from Greenland and the rest from glaciers. Enough to cover a 23-storey building on the beach.
- Coastal cities lost. London, Amsterdam, Venice, Shanghai, Bangkok, Miami and Buenos Aires would be largely underwater; whole low-lying countries like the Netherlands and Bangladesh would mostly disappear.
- The climate shifts. Darker oceans absorb more sunlight, ocean currents change, and coastlines are redrawn on every map.
Why it would get even hotter
Ice is one of Earth's mirrors. Fresh snow and ice reflect up to about 80–90% of sunlight back to space, while open ocean reflects only around 6%. Replace bright ice with dark water and the planet absorbs much more energy. Scientists call this the ice–albedo feedback, and it's one reason the Arctic is warming several times faster than the global average.
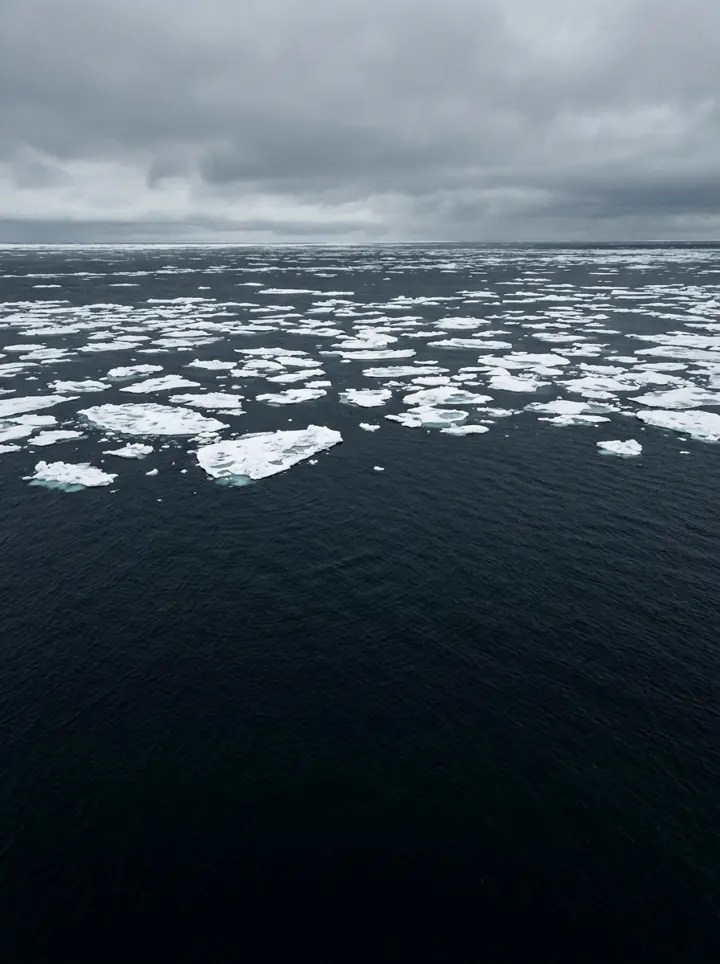
Why Europe might cool
Europe is unusually mild for its latitude partly thanks to a system of Atlantic currents (the AMOC, which includes the Gulf Stream) carrying warm water north. That system depends on cold, salty water sinking in the North Atlantic. A massive pulse of fresh meltwater could weaken it, and past climate records suggest that has happened before, with sharp regional cooling around the North Atlantic.
The slow, real version
The one-day version is fiction, but melting ice is real. According to NOAA, global sea level has risen about 21–24 cm since 1880, and the rate is accelerating as glaciers and ice sheets lose mass. The future is measured in centimetres to metres over this century, not 70 metres overnight. Slower, but much more real.
FAQ
How much would sea level rise if all ice melted?
About 70 metres. Antarctica contributes about 58 m and Greenland about 7 m, with mountain glaciers adding a little more.
Does melting sea ice raise sea level?
Barely. Floating ice already displaces its own weight in water. It's ice on land (ice sheets and glaciers) that raises sea level.
How much has sea level risen so far?
About 21–24 cm (8–9 inches) since 1880, according to NOAA, and it is rising faster now than in the 20th century.
Could all the ice really melt?
Not in a day, but sustained warming over many centuries could melt large parts of the ice sheets, which is why sea-level rise is a major long-term concern.
Sources & further reading
- National Snow and Ice Data Center (NSIDC): Quick facts on ice sheets (Antarctica ~58 m, Greenland ~7.4 m of sea-level equivalent).
- Fretwell, P. et al. (2013). Bedmap2: improved ice bed, surface and thickness datasets for Antarctica. The Cryosphere.
- NOAA Climate.gov: Climate Change: Global Sea Level (21–24 cm rise since 1880).
- Latent heat of fusion of ice (334 kJ/kg) and total solar power intercepted by Earth (~174 PW): standard physics references.
- IPCC AR6 (2021), Working Group I: ocean, cryosphere and sea level change; AMOC.

This is a hypothetical scenario explained with real science. Numbers are rounded for clarity. Images are AI-generated illustrations of real phenomena. Spotted an error? Tell us and we'll fix it.